the cost of foodwaste has increased by 45%
Over the past decade
reaching a cumulative total of NIS 211b (USD $57b), in addition to substantial environmental and health-related costs.
A Decade of Measuring Food Waste and Rescue in Israel

The initiative to publish an annual Food Waste and Rescue Report was born a decade ago, following the release of the 2015 State Comptroller’s report titled Food Loss and Waste: Social, Environmental, and Economic Implications. That report concluded that Israel lacked a central body responsible for collecting data on food waste and rescue, and had no comprehensive policy on the issue. In response, Leket Israel decided to step in and fill this gap, publishing, together with BDO, the first comprehensive report measuring the scale of food loss and waste, the associated costs, and the potential for rescue. Since then, the Report has become an annual publication, and its findings have helped shape both policy and legislation.
A decade later, in October 2025, the State Comptroller published a new report, titled Ensuring Israel’s Food Needs in Emergencies. This report, issued in the wake of the Swords of Iron War, highlights the importance of national food security as a foundation for civilian resilience and economic stability. It also cites the most recent Leket Israel Report, which analyzed agricultural losses during the war.
Decade-long Trends and Indicators Scope of Food Waste:
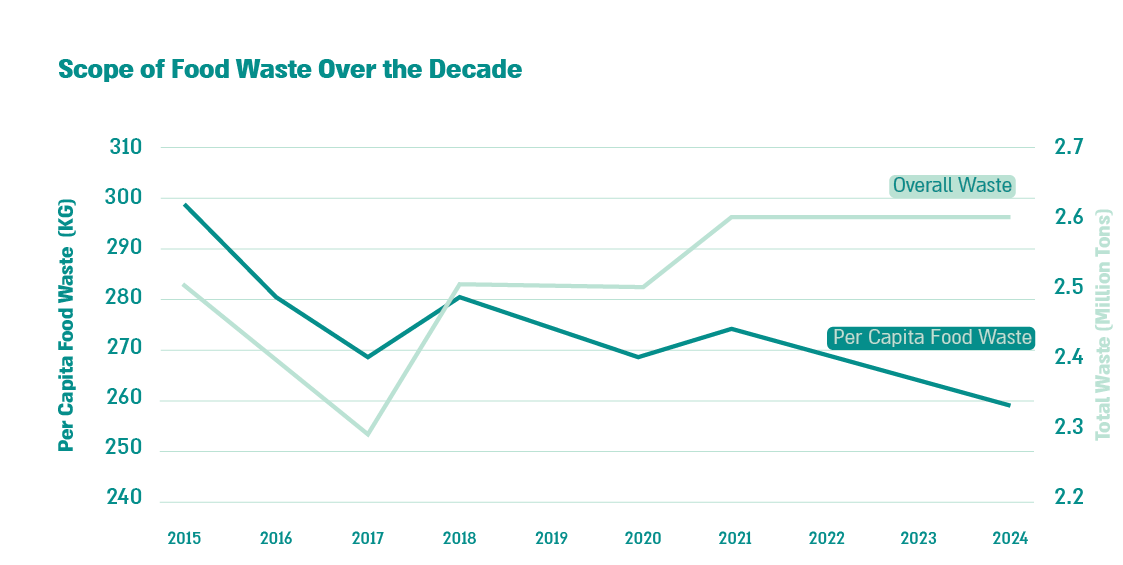
Per capita food waste declined by 13% over the decade. This decline is particularly notable given that Israel’s population grew by 19% during the same period. However, despite the 13% drop in per capita food waste, the total volume of food waste (in tons) increased by 4% over the decade, due to demographic growth. In net terms, this reflects a 6% increase in total food waste. Population growth means more waste generation and more food being lost, which in turn makes the challenge of food rescue even greater.
The reduction in per capita food waste can be attributed to a number of factors, including improved technologies for food preparation and storage, shifts in consumption habits, such as increased online grocery shopping and personal food delivery orders, and growing consumer awareness of the consequences of food waste.

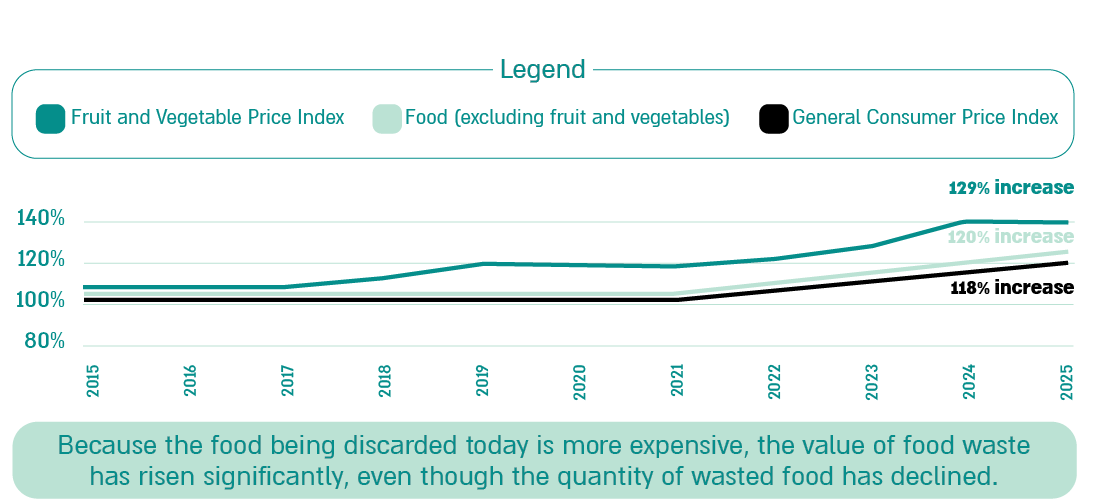
A significant portion of this increase is due to a sharp rise in food prices, particularly for fruit and vegetables, which outpaced general inflation. Between 2015 and 2025, fruit and vegetable prices rose by 29%, compared to an 18% increase in the Consumer Price Index. Other food prices (excluding fruit and vegetables) also increased at a faster rate than the national average, rising by approximately 20% over the same period.
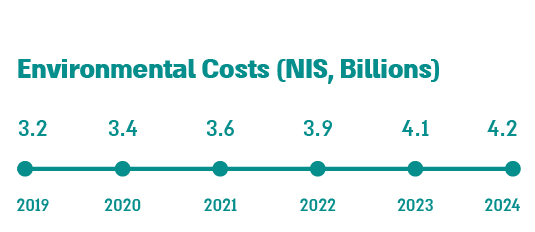
Environmental and health-related costs have also increased over the years:
Environmental costs – which have been measured in this Report since 2019, have risen by 30% during that period. This increase is due to the overall growth in food loss and waste and the fact that a large share of the waste now occurs in the later stages of the value chain—distribution and consumption—where each unit of food already embodies the full environmental footprint accumulated during cultivation, production, packaging, and transportation. Additionally, food waste leads to a greater waste of resources, including water, land, and energy, and increases the volume of waste that requires disposal. Further impacts include rising greenhouse gas emissions and air pollution.
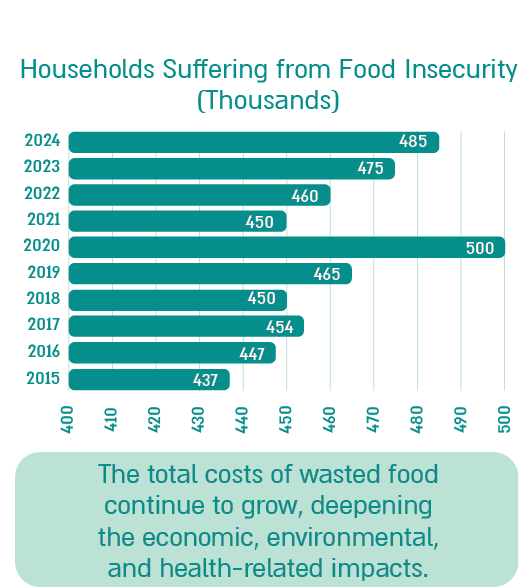
Health costs – The health-related costs of food waste in Israel continue to rise each year, driven by the growing number of households experiencing food insecurity, the deepening severity of that insecurity, and its cumulative impact on public health. Rising prices of healthy foods, combined with widening economic disparities, are leading more households to forgo fruit, vegetables, and other nutritious foods in favor of cheaper, highly processed alternatives that harm health. This poor diet contributes to a steady increase in chronic conditions such as diabetes, obesity, hypertension, and depression, which in turn drive up national expenditures on medical services, medications, and hospitalizations. Because these conditions are long-term and tend to worsen over time, the health consequences and economic costs to the national healthcare system continue to accumulate year after year, becoming more severe as food insecurity expands.
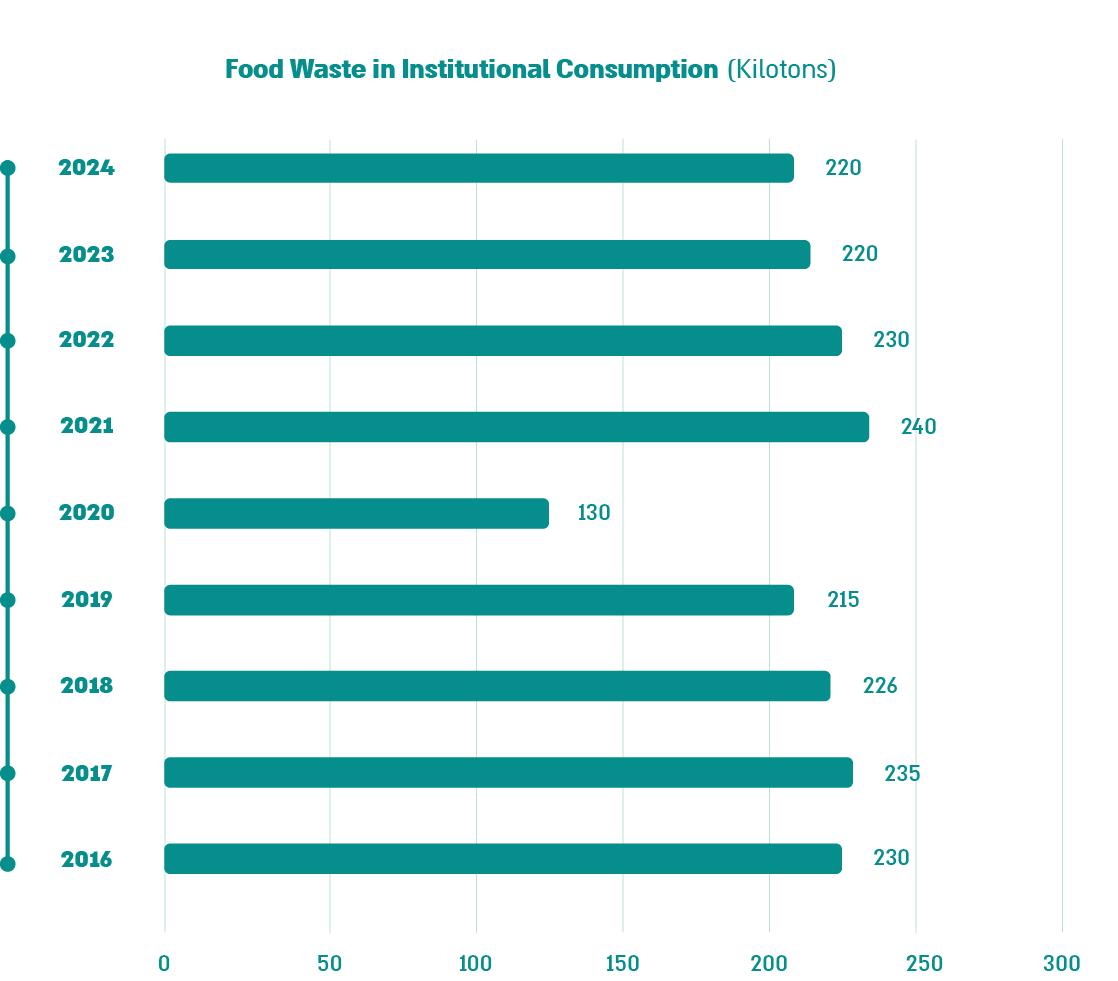
Food waste in institutional consumption was the most volatile among all sectors. The most significant drop occurred during the COVID-19 pandemic, with a 46% decrease in institutional food waste between 2019 and 2020. This reduction was primarily due to a sharp decline in consumption across restaurants, hotels, event venues, workplace catering, and educational institutions as a result of lockdowns and restrictions.
During the Swords of Iron War, there was no overall decrease in institutional food consumption, however the distribution of food consumption shifted among institutional sectors. This was due to a rise in the number of active reservists, reduced physical attendance at workplaces, and the continued impact of COVID-era changes in workplace food consumption patterns, such as remote work and the replacement of dining halls with individually ordered meals.
Agriculture – During the COVID-19 pandemic, agricultural food loss increased by 3%, mainly due to labor shortages during lockdowns, export restrictions, and the closure of the institutional sector.
In the Swords of Iron War, agricultural production declined by 7% in 2023 and by a further 6.7% in 2024. Over 30% of Israel’s agricultural land lies in front-line areas affected by the conflict: approximately 22% in the Tekuma region (Gaza envelope) and another 10% along the northern border. A portion of the decline in agricultural output can be attributed to the increase in crops left unharvested in the field. These crops could not be collected due to either their location in conflict zones or a lack of available labor. However, this production loss is not fully reflected in food loss data, as unplanted crops—while representing a reduction in domestic output—are not classified as food loss under widely accepted international methodologies. Importantly, thanks to extensive volunteer efforts during the war, which helped harvest crops and prevent their loss, the overall damage in the agricultural sector was mitigated.
Household Consumption – During the COVID-19 pandemic, lockdowns and restrictions led to a shift in consumption toward the household sector, resulting in an 8% increase in household food consumption.
Retail and Distribution – During the pandemic food waste declined by 4.5%, due to the closure of open-air markets and a shift toward purchasing from supermarket chains and through online platforms.
Post-Pandemic Impacts – The pandemic brought about structural changes whose effects are still felt today:
- Changes in consumption patterns – including increased online grocery shopping (via both major retailers and private platforms), and the rise of delivery apps (such as Wolt and 10bis).
- Shifts in employment patterns – particularly the transition to remote work, which remains partially in place.
Impact during the Swords of Iron War – Agricultural production was disrupted and reduced due to:
- Limited access to agricultural land.
- Labor shortages affecting harvesting and production.
- Reduced supply of agricultural produce, which led to rising fruit and vegetable prices and a further deterioration in food security.
This raises the question of whether, as with the COVID-19 pandemic, the war will lead to future structural changes. For example:
Will the agricultural labor shortage create an incentive to develop automation and innovation processes that help reduce food loss? And now that the war has underscored the importance of food security as a pillar of national security, will this awareness translate into concrete government policy, both in times of routine and in times of crisis?
These and other questions will be put to the test in the years to come.
Food Rescue Over the Decade
The volume of food actually rescued has grown significantly—increasing 2.25 times over the past decade—and is estimated at approximately 45,000 tons per year as of 2024. This increase can be attributed to growing professionalization and improvement in food rescue operations, including stronger partnerships with farmers and food donors, enhanced logistics systems, and rising public awareness. Despite this progress, only 5% of the rescue potential is currently being realized, highlighting the urgent need to scale up food rescue efforts on a national level.

Policy and Legislation in Israel on Food Loss and Waste (2015–2025)
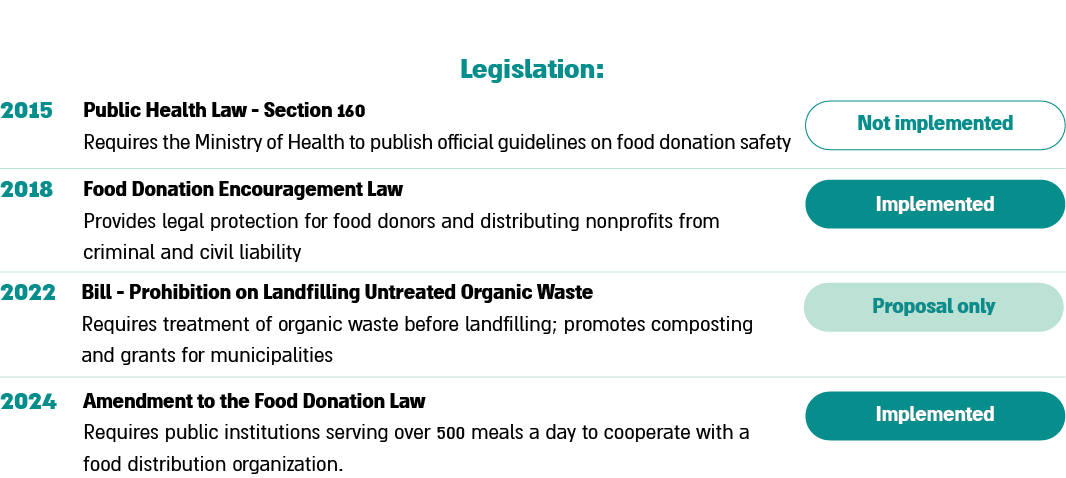
Over the past decade, Israel has taken initial steps to regulate the field of food loss and waste. Foremost among these are the Food Donation Encouragement Law (2018) and its amendment (2024), which established legal protections for food donors and imposed obligations on large public institutions to cooperate in food donation efforts. In parallel, policy frameworks have been developed, including regulatory recommendations on food labeling, donation safety, and mandatory reporting. However, many of these commitments remain at the recommendation stage. While the legislative progress to date is important and reflects a shift in mindset, additional legislation and full implementation of the new National Plan[1] are still required to translate these recommendations into binding measures and close the gap between policy and practice.
Shifts in Public Attitudes Over the Past Decade: Awareness vs. Action
Beyond policy change, consumption patterns, food culture, and food management at both the household and institutional levels play a major role in tackling food waste. Daily consumer decisions—from grocery shopping to behavior at home, in restaurants, and in hotels—directly affect the volume of food waste. Over the past decade, there has been a steady global increase in public awareness of the issue. According to a consumer survey conducted across 11 European countries, consumer awareness of the food they waste has doubled in recent years, reaching 72%.[1] Yet even in Europe, as in Israel and many other countries, a gap persists between awareness and actual behavior. A public opinion survey conducted by the Midgam Institute on behalf of Leket Israel in December 2024 found that while awareness is high, food waste remains widespread: 78% of respondents said they buy fruit and vegetables based on what they expect to consume, however 77% admitted to discarding uneaten food. Among those who claimed to shop carefully, 76% still reported throwing away food to some extent, and among those who said they buy more than they need, 91% reported wasting food. In addition, 39% of Israelis admit that the external appearance of fruit and vegetables influences their purchasing decisions, rising to 54% among young adults aged 18–24.
Engaging the younger generation is considered one of the most effective ways to shape long-term consumption habits and reduce food waste over time. In the European Union, the School Fruit and Vegetable Scheme distributes fresh produce in schools alongside nutrition education, based on the understanding that eating habits are formed at an early age. In the United States, the Fresh Fruit and Vegetable Program (FFVP), operated by the U.S. Department of Agriculture, provides children in under-resourced schools with fresh fruit and vegetables in addition to their meals. Evaluations of the program show increased consumption among participating students. In the United Kingdom, the Jamie’s School Dinners initiative led to a revamping of school menus, incorporating healthier ingredients and raising awareness among students and parents about the importance of proper nutrition. In Hungary, the Project Wasteless program focuses not only on nutrition but also on food waste reduction. Through lessons, games, and school activities, the initiative has succeeded in reducing avoidable food waste by up to 22%. In Israel, Leket Israel’s Leket Bri’ut (“Leket Health”) program aligns with this global trend, by combining the distribution of fruit and vegetables with nutrition education in schools, including education on food waste prevention. Findings from the program’s evaluation show that in 2024, it contributed to increased fruit consumption among parents, particularly in families experiencing a decline in food security, creating a protective effect during a time of crisis. However, the fact that the behavioral change among children themselves was not substantial highlights the challenge of transforming early awareness into lasting habits, and reinforces the importance of consistent, long-term education that begins at an early age.
In the institutional catering sector, new consumer trends are gaining momentum. Across Europe, supermarket chains are offering “imperfect” fruit and vegetables, and hundreds of restaurants have been awarded the Michelin Green Star, which recognizes establishments that meet high sustainability standards. Globally, zero-waste restaurants are becoming a growing trend, including in Israel, where some restaurants have embraced the concept of maximizing the use of each ingredient.
In the hospitality sector, a clear global shift is underway to rethink the traditional buffet format in an effort to reduce food waste. For example, the Scandic hotel chain has reduced pastry sizes, the Ibis hotel chain uses smaller plates to encourage guests to take less food, and hotels such as Novotel Bangkok Sukhumvit display signs with direct messages encouraging guests to avoid waste.
A study conducted in Israel in 2025 examined food waste at hotel breakfast buffets. The findings revealed that guest behavior, according to hotel managers and chefs, is perceived as the primary driver of food waste, followed by overpreparation and excessive serving by the hotels themselves. Behavioral explanations identified in the study include guests’ desire to “get their money’s worth” by overloading plates, and a fear of missing out on tasting opportunities.
In Israel’s major hotel chains (Dan, Fattal, Isrotel), the traditional breakfast buffet has remained largely unchanged and continues to be a defining part of the Israeli hospitality experience. However, among smaller boutique and luxury hotels, there is a noticeable shift toward more measured approaches, including a move to individual portions, or hybrid models combining smaller buffets with table service.
Over the past decade, there has been a growing global trend of integrating food waste reduction into corporate responsibility and ESG (Environmental, Social, and Governance) strategies. According to S&P Global’s 2025 Global Sustainability Report, which reviewed thousands of publicly traded companies, there had been a steady rise in the inclusion of food waste reduction targets in corporate sustainability reports. The percentage of companies addressing this issue increased from 12% in 2022 to approximately 18% in 2024. Furthermore, the data show that around 9% of companies are actively implementing strategies for repurposing surplus food, while roughly 8% are running dedicated programs to reduce food waste. Some have even established measurable goals and timelines to track their progress. In Israel, corporate responsibility in this area is also gaining traction, especially among companies in the food sector. Strauss Group, for instance, has been incorporating food waste reduction targets, surplus donations, and process optimization into its ESG policy for several years now. Sodexo Israel, the institutional catering and services company operating as part of the global Sodexo Group, reported in 2024 a 40% reduction in food waste through the use of the Leanpath Watch-Waste system, preventing the disposal of over 16 tons of food.
In terms of public awareness initiatives, Israel’s Food Waste Awareness Day was launched in 2019 by The Natural Step Israel (TNS) and was expanded two years later into a full awareness week, engaging hundreds of organizations and municipalities. Community initiatives were launched, including the placement of public fridges in markets, and the development of the Israeli app Spare Eat, which enables businesses to offer discounted surprise baskets of food that would otherwise be discarded at the end of the day.
Alongside positive shifts and rising awareness, the persistence of the “value–action gap”—where consumers hold pro-environmental attitudes but struggle to act on them—has emerged as a significant behavioral barrier. A 2025 study published in Scientific Reports examining Generations X and Y in Hungary found that even when individuals were highly aware and willing to reduce food waste, ingrained consumption patterns and cultural perceptions limited actual behavioral change.[2] Another study, published in 2024 in Humanities and Social Sciences Communications, found that intentions to reduce food waste often fail to materialize due to obstacles such as lack of time, unsupportive environments, or social norms. The researchers suggested that reinforcing factors such as ability, opportunities, and social incentives can help bridge the gap from intention to action.[3] Similarly, a 2021 study in Sustainability found that even consumers with strong “green” values often face external barriers, such as cost, consumer norms, or lack of infrastructure, which prevent them from consistently adopting environmentally responsible behaviors.[4]
These findings demonstrate that while the positive trend of growing awareness and isolated changes is important, it is insufficient. Reducing food waste requires a combination of consumer responsibility, effective public policy, economic incentives, and systemic support—without which the gap between values and actions will persist.

[1] Capgemini Research Institute. (2022). Reflect. Rethink. Reconsider. Why food waste is everybody’s problem. Capgemini.
[2] Mucha, M., & Oravecz, R. (2025). Assumptions and perceptions of food wasting behavior and intention to reduce food waste in the case of Generation Y and Generation X. Scientific Reports, 15, 86252. https://doi.org/10.1038/s41598-025-86252-z
[3] Shan, Y., Yang, L., Huang, J., & Liu, W. (2024). How to improve the consistency of consumers’ food waste reduction intentions and behaviors? Humanities and Social Sciences Communications, 11, 375. https://doi.org/10.1057/s41599-024-03975-6
[4] Attiq, S., Raza, S. A., Zia, S., Khan, K. A., & Javed, M. K. (2021). The impact of value-action gap on green consumption behavior: Moderating role of external barriers. Sustainability, 13(14), 7856. https://doi.org/10.3390/su13147856
Achievements and Challenges
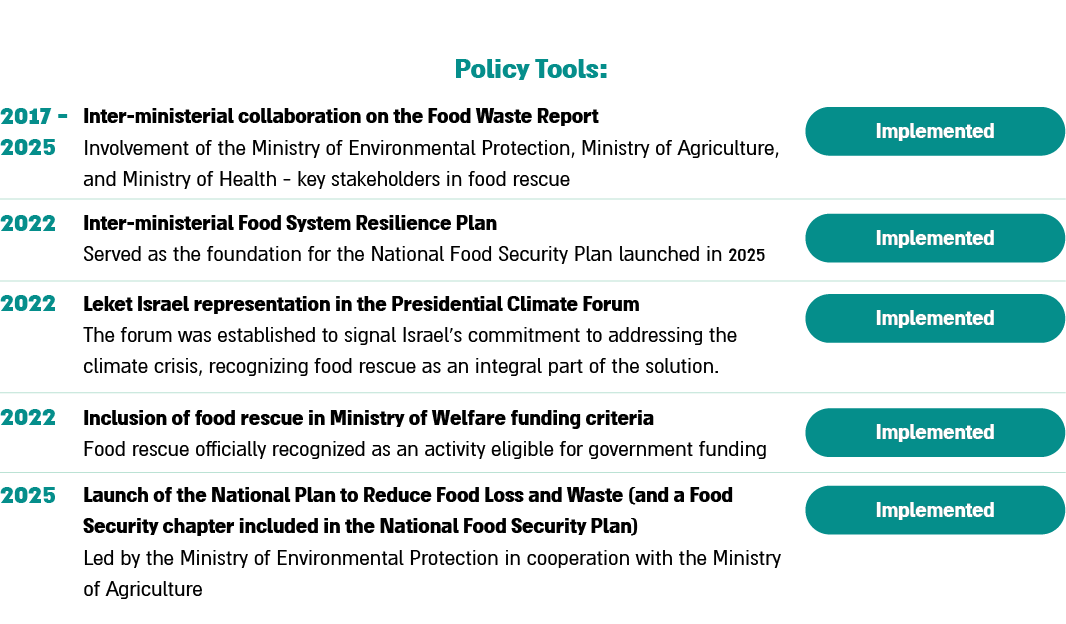
The achievements of the past decade are the result of consistent, systematic efforts to place food loss and waste on Israel’s national agenda. Key milestones include the passage of the Food Donation Act and its 2024 amendment, revisions to government support criteria, the ongoing involvement of relevant ministries in this Report, and ultimately, the development of the National Plan to Reduce Food Loss and Waste, accompanied by a dedicated chapter in the National Food Security Plan.[1] The plan, developed through consultation with dozens of stakeholders and experts, including Leket Israel, represents the first comprehensive governmental framework with defined targets for addressing the issue. The next essential step is to ensure the plan is fully funded and effectively implemented.
In addition to these gains, public awareness has grown, and actions taken over the years have led to a measurable increase in actual food rescue. The estimated volume of rescued food has more than doubled, from 20,000 tons in 2015 to 45,000 tons in 2024 (a 2.25-fold increase). This growth reflects the expanding efforts of organizations engaged in food rescue—foremost among them, Leket Israel.
These and other accomplishments signal a meaningful and positive shift achieved through persistent effort over time, underscoring the importance of continuing to advance this work.
[1] The National Program for Reducing Food Loss and Waste, Ministry of Environmental Protection (2025)
Looking Ahead: Harnessing FoodTech and AI to Combat Food Loss and Waste and Drive Food Rescue
Looking ahead, alongside ongoing policy shifts and the lessons learned from the COVID-19 pandemic and the Swords of Iron War, it is crucial to consider the role of emerging technologies in reducing food loss and waste.
FoodTech is an interdisciplinary field that integrates technology and food science, encompassing the development and application of innovative solutions to optimize food production, extend shelf life, enhance nutritional value, develop alternative proteins, and repurpose organic waste. The sector builds on rapid technological advances in biotechnology, food engineering, smart sensors, and artificial intelligence. The integration of these technologies enables more efficient production processes, enhanced forecasting and supply chain management, and the development of novel packaging and food preservation solutions. As such, the FoodTech industry offers a wide range of tools that can directly contribute to the reduction of food loss and waste.
Israel holds significant potential for continued growth in the FoodTech sector over the coming decade, driven by its unique combination of scientific expertise, agricultural experience, and technological entrepreneurship. This momentum is reflected in the 2025 Agrifood Tech map, published by Startup Nation Central and GrowingIL,[1] which outlines a robust ecosystem of over 750 active companies in the FoodTech and AgriTech domains. These include more than 150 dedicated startups, alongside multinational firms, incubators, research centers, and investors. In 2024 alone, 33 investment rounds exceeded $1m each, with over 30% of the capital directed toward robotics and smart agricultural equipment. Additional high-growth areas included AI-powered solutions and intelligent supply chain management, both closely tied to efforts to minimize food waste.
In the coming years, the FoodTech sector is expected to expand significantly, offering new tools to address global food challenges, including food loss and waste reduction and food rescue. These include:
- Innovation in Early-Stage Production and Supply – Artificial intelligence and smart forecasting systems are increasingly being used to better align supply with demand during the production phase. These systems rely on real-time data analysis algorithms that enable farmers and retail chains to reduce surplus volumes. Examples include:
- Use of drones and sensors for crop monitoring and precision irrigation – Drones provide real-time imagery of crop conditions, allowing farmers, particularly in the United States, Spain, the Netherlands, and France, to detect areas of water shortage or excess. This helps prevent yield loss while conserving resources. In Israel, companies such as Taranis and Prospera are leading examples of the Precision AgTech space, integrating drone technology and computational intelligence to monitor crop health.
- Demand forecasting systems in retail chains (e.g., Walmart and Tesco) that support smart inventory management and help minimize surplus before distribution. By leveraging historical data, weather patterns, and consumer behavior trends, they help balance inventory with actual consumption, thereby reducing unsold food volumes.
Outlook: According to the FAO (2023), the adoption of AI and big data technologies is expected to grow in developing economies as well. This trend will likely position technology-driven food loss reduction at the production stage as a new global standard.[2]
- Innovation Across the Supply Chain – Within the supply chain, Internet of Things (IoT) technologies and smart packaging are gaining increasing prominence. Real-time sensors enable continuous monitoring of temperature and humidity, while smart packaging helps extend the shelf life of perishable products. Examples include:
- Smart packaging with oxygen absorbers to delay spoilage. For instance, U.S.-based Multisorb Technologies develops oxygen-absorbing materials embedded in food packaging to extend the shelf life of meat, cheese, and baked goods. In Japan, oxygen-absorbing packaging is widely used for sushi and ready-made baked items.
- IoT sensors in the transportation of agricultural produce, fish, and dairy products. In Israel, the Xsense system offers a smart cold-chain monitoring solution used to track a wide variety of food items from farm to shelf.
- Producing soups from rescued surplus vegetables – In Israel, Leket Israel’s frozen soup initiative has extended the shelf life of rescued produce. Launched in response to the challenges of supplying fresh food during the COVID-19 pandemic, the project aimed to preserve rescued produce and provide an additional source of nutrition.
Outlook: According to the 2024 UNEP report, the global market for smart packaging is expected to double by the end of the decade, and IoT sensors are projected to become a standard tool in the food industry.[3]
- Innovation in Circularity and Reuse
Transforming food waste into new raw materials is a key component of the circular economy. Through advanced technologies, it is now possible to produce fertilizers, biogas, compostable packaging, and even protein derived from the fermentation of organic waste. Current examples include:
- Biogas facilities in Europe (UK, Italy, and Germany) that convert food waste into energy, thereby reducing greenhouse gas emissions and decreasing the need for landfill disposal.
- Innovative companies developing compostable packaging from natural sources. For example, Notpla (UK) produces seaweed-based packaging, Ecovative (US) uses mushrooms to create biodegradable materials, and TIPA (Israel) manufactures compostable wrapping films as an alternative to plastic.
- Urban initiatives for food waste reuse. In Italy and the Netherlands, surplus food from street markets and the food service sector is collected and redirected for use in energy generation or as compost for urban agriculture.
Outlook: According to the Ellen MacArthur Foundation (2022), by 2030, the circular economy is expected to become a central pillar of both corporate and governmental policy. Solutions for the reuse of food waste will increasingly be adopted at both municipal levels and by manufacturers and retailers.[4]
Investment in the FoodTech sector naturally contributes to reducing food loss and waste, as advanced technologies in preservation, demand forecasting, imperfect produce utilization, and production process optimization enable significant reductions in lost and discarded food across the entire value chain—from farm to consumer.
Israel holds substantial potential for further development in FoodTech over the coming decade, due to its unique combination of scientific expertise, agricultural experience, and technological entrepreneurship.
To realize this potential and position Israel as a global FoodTech leader, several complementary steps are required:
- Supportive government policy – Flexible policy tools that can adapt quickly to changes in the field, incentives for innovation, and the establishment of national targets for food waste reduction through FoodTech solutions.
- Public and private investment in pilot projects and large-scale implementation.
- Bridging research and industry – Encouraging partnerships between academia, startups, and food corporations.
- International collaboration – Engaging with global platforms such as UNEP, OECD, and FAO to scale local solutions for international impact.

[1] 0e38a4_dd262b1d908d41679e18e1fd88d7a28a.pdf
[2] Food and Agriculture Organization of the United Nations. (2023). The State of Food and Agriculture 2023: Revealing true costs for transforming agrifood systems. Rome: FAO. https://doi.org/10.4060/cc7724en
[3] United Nations Environment Programme. (2024). Food Waste Index Report 2024. Nairobi: UNEP. Retrieved from https://www.unep.org/resources/food-waste-index-report-2024
[4] Ellen MacArthur Foundation. (2022). The circular economy in detail: Food Retrieved from https://ellenmacarthurfoundation.org